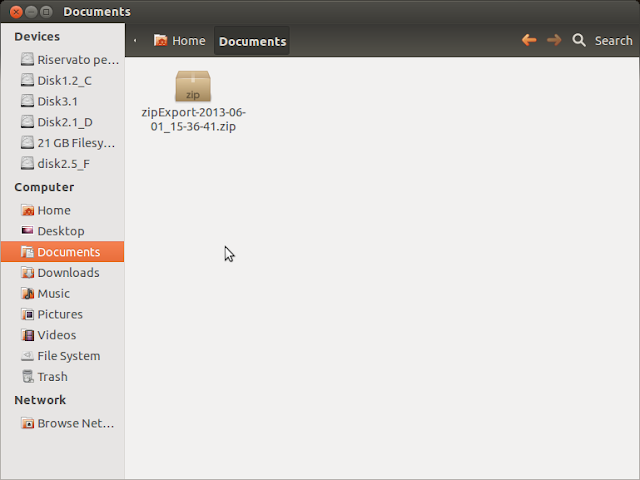
Once you've logged your data with Torque, you should end up with a zip file.
.

you'll find the actual data inside a CSV file.
extract it.
drag it into google drive, selecting "Convert document"
google drive will convert it to a spreadsheet document.
warning: columns order and name may vary according to your PID logging configuration.
first you need to normalize the B column that contains timestamps: we'll need that for later charts.
perform a "find and replace", replacing the first part of the date with a null string.
you'll notice that the B column will be automatically formatted with HH:MM:SS.
now we can draw a chart of RPMs and Speed.
choose Insert -> Chart:
click the small grid inside "Data - Select ranges" and select the following columns in this precise order:
Time
GPS Speed
Engine RPM
the Time column must be the first, so it will be automatically selected for the horizontal axis.
select the area chart type.
with some label customization, the chart is ready for prime time.
now we can try to extract some more data.
add 5 new columns to the right.
insert into M2 the following formula and paste it all the way down:
=if(and(J2=0, C2 <>0);100;0)
meaning that if RPMs (the J column) are zero (engine is idle) and speed (column C) is non-zero (we're moving), we'll have a sintetic value of 100; zero otherwise.
this will highlight when the car is moving with the engine off.
insert into N2 the following formula and paste it all the way down:
=if(C2 <>0;200;0)
if speed is non-zero, we'll have 200 to highlight travelling.
we'll use cell O2 to count the samples when engine was off with the car still moving.
we sum all the M column and divide by the sintetic factor 100, used in the M column formula.
=sum(M2:M991)/100
cell P2 will count travel time by adding column N and dividing by 200.
=sum(N2:N991)/200
now, we can calculate the percentage of time in which the engine was off during the entire trip.
=O2*100/P2
we can have a visual representation of our emission-free traveling by creating a chart of columns B, N and M, as before.


No comments:
Post a Comment