Torque Log Analyzer has grown up: http://torqueloganalyzer.blogspot.it/
Showing posts with label torque. Show all posts
Showing posts with label torque. Show all posts
2013-09-15
Torque Log Analyzer Tool for Google Drive
NOTE: this post refers to an older version of Torque Log Analyzer.
The new version is here: http://torqueloganalyzer.blogspot.it/
Follow this link.
I leave the older version here for reference.
NOTE: this post has been updated: there is new code attached.
Following up my previous rants on driving gamification, I've made a prototype of a Log Analyzer for Torque, that computes some driving parameters.
It's particularly aimed for Toyota HSD hybrid cars.
It's written in Google Script for Google Drive, so it can be used on as many platforms as possible.
First, you need some logs from Torque: here is a tutorial on that.
The PIDs you need to log are:
"Speed (OBD)(km/h)"
"Engine RPM(rpm)"
"Batt Pack Current Val(Amperes)"
"State of Charge(%)"
These PIDs are contained in a HSD specific file you can find here.
Once you've logged your data with Torque, you should end up with a zip file.
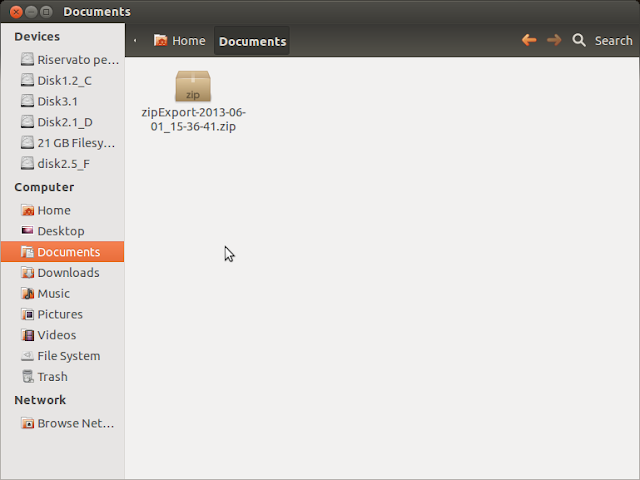
you'll find the actual data inside a CSV file.

extract it.

drag it into google drive, selecting "Convert document"

google drive will convert it to a spreadsheet document.
warning: columns order and name may vary according to your PID logging configuration.
Open the newly created spreadsheet document.

Select "Tool/Script editor..."
Close the wizard window.

Delete any existing code.
Copy and paste the following code:
=== CUT HERE ===
// Torque Log Analyzer for Google Drive
//
// Alessandro Iacopetti, http://pleasedonttouchthescreen.blogspot.it/2013/09/torque-log-analyzer-tool-for-google.html
// free use for non-commercial purposes.
//
// usage:
// load your csv formatted torque log in an empty spreadsheet and then run this script against it
//
// 2013/09/15 - first release
// 2013/09/20 - added some sanity checks, speed variation index, ignitions count
// name of the columns we use
var OBDSpeedName = "Speed (OBD)(km/h)";
var RPMName = "Engine RPM(rpm)";
var BattPackCurrentName = "Batt Pack Current Val(Amperes)";
var SOCName = "State of Charge(%)";
// parameters
var SOCBestValue = 60; // HSD system always tries to maintain this level
var IgnitionMinTime = 5; // seconds under which ICE ignition is considered inefficient
// no user customization under this line
// support columns to be added
var GlideName = "Glide";
var SpeedVarName = "Speed Variation";
// position of columns used in calculation
var OBDSpeed = -1;
var RPM = -1;
var BattPackCurrent = -1;
var SOC = -1;
var Glide = -1;
var SpeedVar = -1;
var NumShortIgnitions = 0;
var NumIgnitions = 0;
function AnalyzeTorqueLogs() {
// logging helpers
function addLogSheet() {
var ss = SpreadsheetApp.getActiveSpreadsheet();
var activesheet = SpreadsheetApp.getActiveSheet();
var sheet = ss.getSheetByName("Log");
if (sheet == null) {
sheet = ss.insertSheet("Log", 1);
}
sheet.setColumnWidth(1, 500);
ss.setActiveSheet(activesheet);
}
function printLog(log) {
var ss = SpreadsheetApp.getActiveSpreadsheet();
var activesheet = SpreadsheetApp.getActiveSheet();
var sheet = ss.getSheetByName("Log");
sheet.appendRow([ log ])
ss.setActiveSheet(activesheet);
}
// data processing
function setDataName() {
var ss = SpreadsheetApp.getActiveSpreadsheet();
var sheet = ss.getSheets()[0];
sheet.setName("Data");
}
// count RPM sequences != 0 less then minimum time
function countShortIgnitions() {
var ss = SpreadsheetApp.getActiveSpreadsheet();
var sheet = ss.getSheets()[0];
var range = sheet.getRange(RPM + "2:" + RPM);
var height = range.getHeight();
var values = range.getValues();
sequencelength = 0;
lastrpm = 0;
for (var i = 0; i < height; ++i) {
if (values[i] != 0) {
sequencelength++;
if (lastrpm == 0)
NumIgnitions++;
}
if (values[i] == 0) {
if (lastrpm != 0) {
if (sequencelength < IgnitionMinTime)
NumShortIgnitions++;
sequencelength = 0;
}
}
lastrpm = values[i];
}
}
function addAnalysisSheet() {
var ss = SpreadsheetApp.getActiveSpreadsheet();
var sheet = ss.getSheetByName("Analysis");
if (sheet == null) {
sheet = ss.insertSheet("Analysis", 1);
}
// SOC
var values = [
[ "Start SOC %" ],
[ "End SOC %" ],
[ "SOC Gain %" ],
[ "Average SOC %" ],
[ "Difference from best %" ],
[ "Standard Deviation" ],
];
var range = sheet.getRange(1, 1, 6, 1);
range.setValues(values);
var values = [
[ "=Data!" + SOC + "2" ],
[ "=INDEX(Data!" + SOC + ":" + SOC + "; COUNT(Data!" + SOC + ":" + SOC + "))" ],
[ "=B2-B1" ],
[ "=AVERAGE(Data!" + SOC + ":" + SOC + ")" ],
[ "=B4-" + SOCBestValue ],
[ "=STDEVP(Data!" + SOC + ":" + SOC + ")" ],
];
var range = sheet.getRange(1, 2, 6, 1);
range.setFormulas(values);
range.setNumberFormat("0.00");
printLog("SOC Analysis added");
// Hybrid
var values = [
[ "ICE off %", "", "Percentage of trip time where the engine was off" ],
[ "Ignitions", "", "Times ICE was turned on" ],
[ "Inefficient Ignitions", "", "Times ICE was turned on for less than " + IgnitionMinTime + " seconds" ],
[ "Glide %", "", "Percentage of driving time where the car was gliding" ],
[ "Longest Glide sequence", "", "Longest glide, in seconds" ],
[ "Battery Stress", "", "Quadratic average of battery current flow" ],
];
var range = sheet.getRange(8, 1, 6, 3);
range.setValues(values);
// formulas are
//=(100*countif(Data!RPM:RPM;0))/count(Data!RPM:RPM)
//=NumIgnitions
//=NumShortIgnitions
//=sum(Data!GLIDE:GLIDE)/countif(Data!SPEED:SPEED, ">0")*100
//=arrayformula(MAX(FREQUENCY(IF(Data!GLIDE:GLIDE=1,ROW(Data!GLIDE:GLIDE)),IF(Data!GLIDE:GLIDE<>1,ROW(Data!GLIDE:GLIDE)))))
//=sqrt(sumsq(Data!BATTERY:BATTERY)/count(Data!BATTERY:BATTERY))
countShortIgnitions();
var values = [
[ "=(100*countif(Data!" + RPM + ":" + RPM + ";0))/count(Data!" + RPM + ":" + RPM + ")" ],
[ NumIgnitions ],
[ NumShortIgnitions ],
[ "=sum(Data!" + Glide + ":" + Glide + ")/countif(Data!" + OBDSpeed + ":" + OBDSpeed + "; \">0\")*100" ],
[ "=arrayformula(MAX(FREQUENCY(IF(Data!" + Glide + ":" + Glide + "=1;ROW(Data!" + Glide + ":" + Glide + "));IF(Data!" + Glide + ":" + Glide + "<>1;ROW(Data!" + Glide + ":" + Glide + ")))))" ],
[ "=sqrt(sumsq(Data!" + BattPackCurrent + ":" + BattPackCurrent + ")/count(Data!" + BattPackCurrent + ":" + BattPackCurrent + "))" ],
];
var range = sheet.getRange(8, 2, 6, 1);
range.setFormulas(values);
range.setNumberFormat("0.00");
printLog("Hybrid Analysis added");
var values = [
[ "Average Speed", "", "Km/h" ],
[ "Top Speed", "", "Km/h" ],
[ "Average Absolute Variation", "", "Speed variations during the trip (only while moving): measure your driving style" ],
];
var range = sheet.getRange(15, 1, 3, 3);
range.setValues(values);
// formulas are
//=AVERAGE(Data!SPEED:SPEED)
//=Max(Data!SPEED:SPEED)
//=sqrt(sumsq(Data!SPEEDVAR:SPEEDVAR)/countif(Data!SPEED:SPEED, ">0"))
var values = [
[ "=AVERAGE(Data!" + OBDSpeed + ":" + OBDSpeed + ")" ],
[ "=Max(Data!" + OBDSpeed + ":" + OBDSpeed + ")" ],
[ "=sqrt(sumsq(Data!" + SpeedVar + ":" + SpeedVar + ")/countif(Data!" + OBDSpeed + ":" + OBDSpeed + "; \">0\"))" ],
];
var range = sheet.getRange(15, 2, 3, 1);
range.setFormulas(values);
range.setNumberFormat("0.00");
sheet.autoResizeColumn(1);
sheet.autoResizeColumn(2);
sheet.autoResizeColumn(3);
printLog("Analysis sheet added");
}
function insertSeparatorColumn() {
var alreadyexist = findColumnByName("|");
if (alreadyexist != -1) {
return;
}
var ss = SpreadsheetApp.getActiveSpreadsheet();
var sheet = ss.getSheetByName("Data");
var last = sheet.getLastColumn();
sheet.insertColumnAfter(last);
var cell = sheet.getRange(1, last + 1);
cell.setValue("|");
var rangeToCopy = sheet.getRange(1, last + 1, 1, 1);
rangeToCopy.copyTo(sheet.getRange(2, last + 1, sheet.getLastRow() - 1, 1));
sheet.autoResizeColumn(1);
printLog("separator column added");
}
function insertSpeedVarColumn() {
SpeedVar = findColumnByName(SpeedVarName);
if (SpeedVar != -1) {
return;
}
var ss = SpreadsheetApp.getActiveSpreadsheet();
var sheet = ss.getSheetByName("Data");
var last = sheet.getLastColumn();
sheet.insertColumnAfter(last);
// first 2 cells are constant
var values = [
[ SpeedVarName ],
[ "0" ],
];
var range = sheet.getRange(1, last + 1, 2, 1);
range.setValues(values);
// formula is "=SPEED3-SPEED2"
var cell = sheet.getRange(3, last + 1);
cell.setFormula("=" + OBDSpeed + "3-" + OBDSpeed + "2");
var rangeToCopy = sheet.getRange(3, last + 1, 1, 1);
rangeToCopy.copyTo(sheet.getRange(3, last + 1, sheet.getLastRow() - 2, 1));
SpeedVar = findColumnByName(SpeedVarName);
printLog("speed variation column added");
}
function insertGlideColumn() {
Glide = findColumnByName(GlideName);
if (Glide != -1) {
return;
}
var ss = SpreadsheetApp.getActiveSpreadsheet();
var sheet = ss.getSheetByName("Data");
var last = sheet.getLastColumn();
sheet.insertColumnAfter(last);
var range = sheet.getRange(1, last + 1, 1, 1);
range.setValue(GlideName);
// formula is "=if(and(RPM2<500;SPEED2>10;abs(BATTPACKCURRENT2)<5);1;0)"
var cell = sheet.getRange(2, last + 1);
cell.setFormula("=if(and(" + RPM + "2<500;" + OBDSpeed + "2>10;abs(" + BattPackCurrent + "2)<5);1;0)");
var rangeToCopy = sheet.getRange(2, last + 1, 1, 1);
rangeToCopy.copyTo(sheet.getRange(2, last + 1, sheet.getLastRow() - 1, 1));
Glide = findColumnByName(GlideName);
printLog("glide column added");
}
function activateSheetByName(name) {
var ss = SpreadsheetApp.getActiveSpreadsheet();
var sheet = ss.getSheetByName(name);
ss.setActiveSheet(sheet);
}
// returns only letter of the column with the given name in the first cell
function findColumnByName(name) {
var ss = SpreadsheetApp.getActiveSpreadsheet();
var sheet = ss.getSheetByName("Data");
var last = sheet.getLastColumn();
var foundcolumn = -1;
for (var i = 1; i <= last; i++) {
var cell = sheet.getRange(1, i);
var value = cell.getValue();
if (value == name) {
foundcolumn = cell.getA1Notation();
printLog("Found column " + name + " at " + foundcolumn);
}
}
if (foundcolumn == -1) {
printLog("Column " + name + " not found");
}
else {
foundcolumn = foundcolumn.substring(0, foundcolumn.length - 1);
}
return foundcolumn;
}
// set "-" to "0" and check if there are values > max
function sanitizeColumn(column, max) {
var ss = SpreadsheetApp.getActiveSpreadsheet();
var sheet = ss.getSheets()[0];
var range = sheet.getRange(column + ":" + column );
var height = range.getHeight();
var values = range.getValues();
var foundnull = false;
printLog("checking " + height + " values at column " + column);
for (var i = 0; i < height; ++i) {
if (values[i] == "-") {
var cell = range.getCell(i + 1, 1);
cell.setValue(0);
foundnull = true;
}
if (values[i] > max) {
printLog("ERROR: Values in column " + column + " out of range, check for import errors");
}
}
if (foundnull)
printLog("some missing values in column " + column);
}
// set global vars to columns position
function findNeededColumns() {
OBDSpeed = findColumnByName(OBDSpeedName);
RPM = findColumnByName(RPMName);
BattPackCurrent = findColumnByName(BattPackCurrentName);
SOC = findColumnByName(SOCName);
}
function sanitizeNeededColumns() {
sanitizeColumn(OBDSpeed, 300);
sanitizeColumn(RPM, 10000);
sanitizeColumn(BattPackCurrent, 300);
sanitizeColumn(SOC, 100);
}
// main
addLogSheet();
printLog("Begin data processing");
setDataName();
activateSheetByName("Data");
findNeededColumns();
sanitizeNeededColumns();
insertSeparatorColumn();
if (OBDSpeed != -1) {
insertSpeedVarColumn();
}
else {
printLog("ERROR: Could not add speed variance column");
}
if ((OBDSpeed != -1) && (RPM != -1) && (BattPackCurrent != -1)) {
insertGlideColumn();
}
else {
printLog("ERROR: Could not add glide column");
}
addAnalysisSheet();
printLog("End data processing");
}
=== CUT HERE ===

Now select "File / Save" and then "Run / AnalyzeTorqueLogs"
You will have to authorize the script


After the script has finished running, switch back to the spreadsheet, and you'll see a new tab named "Analysis".

This first version compute some sample parameters regarding the HV battery:
start and end charge, and average value vs the value considered the best by some hypermilers (60%).
There are some other values that may answer some curiosity about the car inner working:
the percentage of the time the petrol engine was actually off during the trip,
the percentage of time the car was moving using very little energy (glide),
the longest glide time of the trip
a battery "stress" value, that evaluates how may amperes have flown in and out of the battery: a higher value means higher stress, but a meaningful range has yet to be established.
NOTE:
This new version add some parameters:
how many times ICE was turned on during the trip
how many ICE ignitions lasted less than 5 seconds (those are considered just a waste of fuel)
an evaluation of speed variance during the trip: this should give an idea of your driving stile (calm or aggressive).
| Ignitions | 13.00 | Times ICE was turned on |
| Inefficient Ignitions | 1.00 | Times ICE was turned on for less than 5 seconds |
| Average Speed | 41.08 | |
| Top Speed | 77.00 | |
| Average Absolute Variation | 1.97 | Speed variations during the trip (only while moving) |
2013-09-14
Rorschach Test
These are data of car speed at various RPMs.
Same road, different driving stile:

.png)
 We always have 2 aggregation points:
one at 0 RPM, where we have the car running on electric power up to 70 km/h, and one at 1300 RPM, that seems to be the sweet spot of the engine.
Speedy driving leads to higher RPM and a wider distribution.
Use of EV mode, leads to higher RPM than normal: note the aggregation around 2100 and the gap between 1300 and 1600.
Same road, different driving stile:
one at 0 RPM, where we have the car running on electric power up to 70 km/h, and one at 1300 RPM, that seems to be the sweet spot of the engine.
Speedy driving leads to higher RPM and a wider distribution.
Use of EV mode, leads to higher RPM than normal: note the aggregation around 2100 and the gap between 1300 and 1600.
2013-09-05
Torque Game
Driving gamification is something I had in my mind for some time.
Torque seems to be a good starting point, so I asked on the Torque support forum for a plugin that can provide some data to play with.
No one answered, so far; so I began experimenting myself.
I'm collecting Torque logs on a known road trip, changing driving style from time to time, to build a library of trips.
Here are the first:
https://drive.google.com/folderview?id=0B8xG59QDgvQ3OS1SU3BVYVQxQTA&usp=sharing
I'm adding an Analysis tab where I'm experimenting with statistical functions that can measure a trip and give a score that can be compared with other trips to find the "perfect driving style".
There's a thread about this on the Hybrid Synergy Forum.
2013-07-05
Speed and Charge
How much current can you get from speed?
In the following graph:
- speed is in blue, left vertical axis
- RPMs in red, right axis, useful to check when the engine stops beeing dragged.
- change current in yellow, left axis, negative values are indicative of recharge.

I drove a straigh, plain road up to 76 km/h and then I left the accelerator pedal alone, to let the car loose speed until 46 km/h (see the blue line decreasing over time)
The engine continued to spin without burning any fuel, then at 66 km/h it stopped (see the sudden break in the red line).
Charging current is not steady, it follows the speed, but not linearly (check the yellow line, lower values mean higher charge).
A graph of current values by speed shows a pattern:

The higher recharge effect is at 66 km/h with 24A.
That is precisely the speed where the engine stopped, but neighbouring values vary widely.
The slope returns to a linear behavior at 62 km/h with 22A.
So, if you're going to drive down a hill and you want to maximize your recharge, it's better to drive at 60 km/h rather than 70.
2013-06-15
Using Google Docs to chart Torque data
Once you've logged your data with Torque, you should end up with a zip file.
.
you'll find the actual data inside a CSV file.
extract it.
drag it into google drive, selecting "Convert document"
google drive will convert it to a spreadsheet document.
warning: columns order and name may vary according to your PID logging configuration.

first you need to normalize the B column that contains timestamps: we'll need that for later charts.
perform a "find and replace", replacing the first part of the date with a null string.

you'll notice that the B column will be automatically formatted with HH:MM:SS.

now we can draw a chart of RPMs and Speed.
choose Insert -> Chart:

click the small grid inside "Data - Select ranges" and select the following columns in this precise order:
Time
GPS Speed
Engine RPM
the Time column must be the first, so it will be automatically selected for the horizontal axis.

select the area chart type.

with some label customization, the chart is ready for prime time.
now we can try to extract some more data.
add 5 new columns to the right.

insert into M2 the following formula and paste it all the way down:
=if(and(J2=0, C2 <>0);100;0)
meaning that if RPMs (the J column) are zero (engine is idle) and speed (column C) is non-zero (we're moving), we'll have a sintetic value of 100; zero otherwise.
this will highlight when the car is moving with the engine off.
insert into N2 the following formula and paste it all the way down:
=if(C2 <>0;200;0)
if speed is non-zero, we'll have 200 to highlight travelling.
we'll use cell O2 to count the samples when engine was off with the car still moving.
we sum all the M column and divide by the sintetic factor 100, used in the M column formula.
=sum(M2:M991)/100
cell P2 will count travel time by adding column N and dividing by 200.
=sum(N2:N991)/200
now, we can calculate the percentage of time in which the engine was off during the entire trip.
=O2*100/P2
we can have a visual representation of our emission-free traveling by creating a chart of columns B, N and M, as before.

2013-06-13
Torque Logging Tutorial
Select "Settings" from the main screen menu.

Select "Data Logging & Upload"

Touch "Select what to log"

Using "Add PID to log" select which values you want to collect

Back to the previous screen, scroll down to select "Also log selected sensors"

Connect to the car, go to the "Realtime Information" screen and select "Start Logging"

When you trip is over, select "Stop Logging" and go to the Map View screen.
Use "Select recorded trip" to load your previous log file.

Then select "Send trip file.."
Select CSV, and copy the file.

2013-06-11
Braking, HSD style.
Here is a long brake on a straight road, right before a traffic light.
Speed in blue
Hydraulic brake in black
Charging current in red
 At 5:02:22, at a speed of 57 km/h, I began applying pressure on the brake pedal.
I applied the same pressure throughout the whole maneuver.
As soon as began braking, some current started flowing to the battery as the charging effect of the speed loss.
Current topped at 75A at 41 km/h.
At 5:02:37, as soon as speed lowered to 10 km/h, hydraulic braking kicked in.
Speed in blue
Hydraulic brake in black
Charging current in red
I applied the same pressure throughout the whole maneuver.
As soon as began braking, some current started flowing to the battery as the charging effect of the speed loss.
Current topped at 75A at 41 km/h.
At 5:02:37, as soon as speed lowered to 10 km/h, hydraulic braking kicked in.
2013-06-10
Downhill reloaded
I tested again the same slope.
This time driving in D.
 It seems there's still an exponential charging at the beginning (15:13:00 - 15:13:45), and then a linear progression.
Here's the speed graph:
 One hypothesis for the change from exponential to linear of the charging progression was battery temperature.
 Here's the current flow, charging the battery.
At 15:14:25 there's a sudden break.

At that time, the system began to use hydraulic brakes.
Note that at 15:14:45 brakes were not in use, but Amperes stayed low, even if speed was well in excess of 45km/h.

This time driving in D.
Here's the speed graph:
At 15:14:25 there's a sudden break.
At that time, the system began to use hydraulic brakes.
Note that at 15:14:45 brakes were not in use, but Amperes stayed low, even if speed was well in excess of 45km/h.
2013-06-03
Start-Stop vs HSD
"My car also turns itself off at a traffic light!"
This is a classic when someone is on the passenger seat, while driving.
Modern, non-hybrid cars have a start-stop system that shuts the engine down while standing still.
This is fundamentally different from an hybrid car:
A conventional car shuts the engine off after the car has stopped, and re-ignite it before moving again.
The HSD system works the opposite way: the engine shuts down before stopping and it starts again after the car is already moving.
Here is the detail of a stop at a traffic light.
Engine rpms in red; speed in blue.
The car comes to a full stop a 15:09:35 and starts again at 15:09:40:

Driving downhill in B
I tried the same slope using the B gear instead of D.
Here is the original graph, while driving in D:
 Now the same road again, in B:

The battery started at a different level then before but, driving in B, gained a 13% charge, a minimal difference against the 14% gained while driving in D.
Here are the speed graphs.
D:
 B:
B:
 Driving in B will force you to press the gas pedal to gain some speed where the slope is not steep enough.
Look at 19:06:30, where the slope begins: the car builds up speed slower than when driving in D.
Some more graphs:


.png)
Here is the original graph, while driving in D:
The battery started at a different level then before but, driving in B, gained a 13% charge, a minimal difference against the 14% gained while driving in D.
Here are the speed graphs.
D:
Look at 19:06:30, where the slope begins: the car builds up speed slower than when driving in D.
Some more graphs:
Subscribe to:
Posts (Atom)