Given the consistent results I've got with my previous modification, I've dared a little more.
I fitted some cheap pipe insulators in the remaining slots of the radiator grill:
The lower insulator is kept in place by pressure from the license plate, while I fixed the upper one with a couple plastic ties.
I was worried this type of insulation will prevent the engine from refreshing and will cause it to overheat.
As a stress test, I drove for an hour on various medium/high speed roads and some steep hills.
Even though the weather was sunny and the ambient temperature was 7 degress, coolant temperature reached 90 degrees and didn't go any further.
Countless times I've found solutions on the net: I'll try to give back some, by sharing interesting things I'll come across.
Showing posts with label yaris hybrid. Show all posts
2013-12-31
2013-12-18
Covering the Yaris radiator
Low temperature causes higher fuel consumption, so I tried an old trick.
In a car accessory shop, I've found and old Fiat 127 radiator rubber cover. The owner was pleased to sell it to me at a discounted price, since he said nobody uses it anymore.
Colour and size are just fine for the Yaris.
I just had to cut some holes to fit 3 plastic cable ties to grab it to the rear mask.
There are even some windows that can be opened to regulate air flow in warmer days.
Results are encouraging.
In a car accessory shop, I've found and old Fiat 127 radiator rubber cover. The owner was pleased to sell it to me at a discounted price, since he said nobody uses it anymore.
Colour and size are just fine for the Yaris.
I just had to cut some holes to fit 3 plastic cable ties to grab it to the rear mask.
There are even some windows that can be opened to regulate air flow in warmer days.
Results are encouraging.
2013-12-15
Yaris 12V again
It seems that even the older Yaris has a 12V clamp in the hood that can be used for jump starting the car.
According to this Spanish forum:It's possible to use the highlighted connector in the HV fuse box that carries the +12V from the battery.
The bolt in the lower right corner can be used for the negative clamp.
http://mitoyotaprius.mforos.com/2042955/11364755-yaris-HSD-jump-start-clamps-in-the-hood/
Checking the 12V battery from the OBD port
The OBD port, located under the steering wheel, carries a +12V line from the battery.
It can be used to check battery charge without opening anything.
Just put your tester terminals on pins 4 and 16:
It can be used to check battery charge without opening anything.
Just put your tester terminals on pins 4 and 16:
2013-09-15
Torque Log Analyzer Tool for Google Drive
NOTE: this post refers to an older version of Torque Log Analyzer.
The new version is here: http://torqueloganalyzer.blogspot.it/
Follow this link.
I leave the older version here for reference.
NOTE: this post has been updated: there is new code attached.
Following up my previous rants on driving gamification, I've made a prototype of a Log Analyzer for Torque, that computes some driving parameters.
It's particularly aimed for Toyota HSD hybrid cars.
It's written in Google Script for Google Drive, so it can be used on as many platforms as possible.
First, you need some logs from Torque: here is a tutorial on that.
The PIDs you need to log are:
"Speed (OBD)(km/h)"
"Engine RPM(rpm)"
"Batt Pack Current Val(Amperes)"
"State of Charge(%)"
These PIDs are contained in a HSD specific file you can find here.
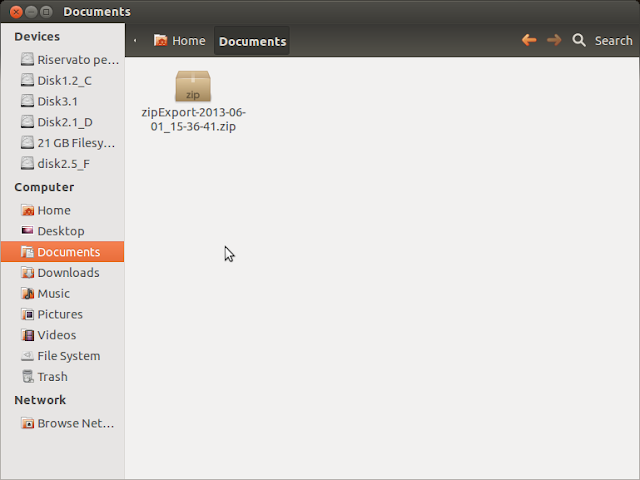
Once you've logged your data with Torque, you should end up with a zip file.
The new version is here: http://torqueloganalyzer.blogspot.it/
Follow this link.
I leave the older version here for reference.
NOTE: this post has been updated: there is new code attached.
Following up my previous rants on driving gamification, I've made a prototype of a Log Analyzer for Torque, that computes some driving parameters.
It's particularly aimed for Toyota HSD hybrid cars.
It's written in Google Script for Google Drive, so it can be used on as many platforms as possible.
First, you need some logs from Torque: here is a tutorial on that.
The PIDs you need to log are:
"Speed (OBD)(km/h)"
"Engine RPM(rpm)"
"Batt Pack Current Val(Amperes)"
"State of Charge(%)"
These PIDs are contained in a HSD specific file you can find here.
Once you've logged your data with Torque, you should end up with a zip file.

you'll find the actual data inside a CSV file.
extract it.
drag it into google drive, selecting "Convert document"
google drive will convert it to a spreadsheet document.
warning: columns order and name may vary according to your PID logging configuration.
Open the newly created spreadsheet document.
Select "Tool/Script editor..."
Close the wizard window.
Delete any existing code.
Copy and paste the following code:
=== CUT HERE ===
// Torque Log Analyzer for Google Drive
//
// Alessandro Iacopetti, http://pleasedonttouchthescreen.blogspot.it/2013/09/torque-log-analyzer-tool-for-google.html
// free use for non-commercial purposes.
//
// usage:
// load your csv formatted torque log in an empty spreadsheet and then run this script against it
//
// 2013/09/15 - first release
// 2013/09/20 - added some sanity checks, speed variation index, ignitions count
// name of the columns we use
var OBDSpeedName = "Speed (OBD)(km/h)";
var RPMName = "Engine RPM(rpm)";
var BattPackCurrentName = "Batt Pack Current Val(Amperes)";
var SOCName = "State of Charge(%)";
// parameters
var SOCBestValue = 60; // HSD system always tries to maintain this level
var IgnitionMinTime = 5; // seconds under which ICE ignition is considered inefficient
// no user customization under this line
// support columns to be added
var GlideName = "Glide";
var SpeedVarName = "Speed Variation";
// position of columns used in calculation
var OBDSpeed = -1;
var RPM = -1;
var BattPackCurrent = -1;
var SOC = -1;
var Glide = -1;
var SpeedVar = -1;
var NumShortIgnitions = 0;
var NumIgnitions = 0;
function AnalyzeTorqueLogs() {
// logging helpers
function addLogSheet() {
var ss = SpreadsheetApp.getActiveSpreadsheet();
var activesheet = SpreadsheetApp.getActiveSheet();
var sheet = ss.getSheetByName("Log");
if (sheet == null) {
sheet = ss.insertSheet("Log", 1);
}
sheet.setColumnWidth(1, 500);
ss.setActiveSheet(activesheet);
}
function printLog(log) {
var ss = SpreadsheetApp.getActiveSpreadsheet();
var activesheet = SpreadsheetApp.getActiveSheet();
var sheet = ss.getSheetByName("Log");
sheet.appendRow([ log ])
ss.setActiveSheet(activesheet);
}
// data processing
function setDataName() {
var ss = SpreadsheetApp.getActiveSpreadsheet();
var sheet = ss.getSheets()[0];
sheet.setName("Data");
}
// count RPM sequences != 0 less then minimum time
function countShortIgnitions() {
var ss = SpreadsheetApp.getActiveSpreadsheet();
var sheet = ss.getSheets()[0];
var range = sheet.getRange(RPM + "2:" + RPM);
var height = range.getHeight();
var values = range.getValues();
sequencelength = 0;
lastrpm = 0;
for (var i = 0; i < height; ++i) {
if (values[i] != 0) {
sequencelength++;
if (lastrpm == 0)
NumIgnitions++;
}
if (values[i] == 0) {
if (lastrpm != 0) {
if (sequencelength < IgnitionMinTime)
NumShortIgnitions++;
sequencelength = 0;
}
}
lastrpm = values[i];
}
}
function addAnalysisSheet() {
var ss = SpreadsheetApp.getActiveSpreadsheet();
var sheet = ss.getSheetByName("Analysis");
if (sheet == null) {
sheet = ss.insertSheet("Analysis", 1);
}
// SOC
var values = [
[ "Start SOC %" ],
[ "End SOC %" ],
[ "SOC Gain %" ],
[ "Average SOC %" ],
[ "Difference from best %" ],
[ "Standard Deviation" ],
];
var range = sheet.getRange(1, 1, 6, 1);
range.setValues(values);
var values = [
[ "=Data!" + SOC + "2" ],
[ "=INDEX(Data!" + SOC + ":" + SOC + "; COUNT(Data!" + SOC + ":" + SOC + "))" ],
[ "=B2-B1" ],
[ "=AVERAGE(Data!" + SOC + ":" + SOC + ")" ],
[ "=B4-" + SOCBestValue ],
[ "=STDEVP(Data!" + SOC + ":" + SOC + ")" ],
];
var range = sheet.getRange(1, 2, 6, 1);
range.setFormulas(values);
range.setNumberFormat("0.00");
printLog("SOC Analysis added");
// Hybrid
var values = [
[ "ICE off %", "", "Percentage of trip time where the engine was off" ],
[ "Ignitions", "", "Times ICE was turned on" ],
[ "Inefficient Ignitions", "", "Times ICE was turned on for less than " + IgnitionMinTime + " seconds" ],
[ "Glide %", "", "Percentage of driving time where the car was gliding" ],
[ "Longest Glide sequence", "", "Longest glide, in seconds" ],
[ "Battery Stress", "", "Quadratic average of battery current flow" ],
];
var range = sheet.getRange(8, 1, 6, 3);
range.setValues(values);
// formulas are
//=(100*countif(Data!RPM:RPM;0))/count(Data!RPM:RPM)
//=NumIgnitions
//=NumShortIgnitions
//=sum(Data!GLIDE:GLIDE)/countif(Data!SPEED:SPEED, ">0")*100
//=arrayformula(MAX(FREQUENCY(IF(Data!GLIDE:GLIDE=1,ROW(Data!GLIDE:GLIDE)),IF(Data!GLIDE:GLIDE<>1,ROW(Data!GLIDE:GLIDE)))))
//=sqrt(sumsq(Data!BATTERY:BATTERY)/count(Data!BATTERY:BATTERY))
countShortIgnitions();
var values = [
[ "=(100*countif(Data!" + RPM + ":" + RPM + ";0))/count(Data!" + RPM + ":" + RPM + ")" ],
[ NumIgnitions ],
[ NumShortIgnitions ],
[ "=sum(Data!" + Glide + ":" + Glide + ")/countif(Data!" + OBDSpeed + ":" + OBDSpeed + "; \">0\")*100" ],
[ "=arrayformula(MAX(FREQUENCY(IF(Data!" + Glide + ":" + Glide + "=1;ROW(Data!" + Glide + ":" + Glide + "));IF(Data!" + Glide + ":" + Glide + "<>1;ROW(Data!" + Glide + ":" + Glide + ")))))" ],
[ "=sqrt(sumsq(Data!" + BattPackCurrent + ":" + BattPackCurrent + ")/count(Data!" + BattPackCurrent + ":" + BattPackCurrent + "))" ],
];
var range = sheet.getRange(8, 2, 6, 1);
range.setFormulas(values);
range.setNumberFormat("0.00");
printLog("Hybrid Analysis added");
var values = [
[ "Average Speed", "", "Km/h" ],
[ "Top Speed", "", "Km/h" ],
[ "Average Absolute Variation", "", "Speed variations during the trip (only while moving): measure your driving style" ],
];
var range = sheet.getRange(15, 1, 3, 3);
range.setValues(values);
// formulas are
//=AVERAGE(Data!SPEED:SPEED)
//=Max(Data!SPEED:SPEED)
//=sqrt(sumsq(Data!SPEEDVAR:SPEEDVAR)/countif(Data!SPEED:SPEED, ">0"))
var values = [
[ "=AVERAGE(Data!" + OBDSpeed + ":" + OBDSpeed + ")" ],
[ "=Max(Data!" + OBDSpeed + ":" + OBDSpeed + ")" ],
[ "=sqrt(sumsq(Data!" + SpeedVar + ":" + SpeedVar + ")/countif(Data!" + OBDSpeed + ":" + OBDSpeed + "; \">0\"))" ],
];
var range = sheet.getRange(15, 2, 3, 1);
range.setFormulas(values);
range.setNumberFormat("0.00");
sheet.autoResizeColumn(1);
sheet.autoResizeColumn(2);
sheet.autoResizeColumn(3);
printLog("Analysis sheet added");
}
function insertSeparatorColumn() {
var alreadyexist = findColumnByName("|");
if (alreadyexist != -1) {
return;
}
var ss = SpreadsheetApp.getActiveSpreadsheet();
var sheet = ss.getSheetByName("Data");
var last = sheet.getLastColumn();
sheet.insertColumnAfter(last);
var cell = sheet.getRange(1, last + 1);
cell.setValue("|");
var rangeToCopy = sheet.getRange(1, last + 1, 1, 1);
rangeToCopy.copyTo(sheet.getRange(2, last + 1, sheet.getLastRow() - 1, 1));
sheet.autoResizeColumn(1);
printLog("separator column added");
}
function insertSpeedVarColumn() {
SpeedVar = findColumnByName(SpeedVarName);
if (SpeedVar != -1) {
return;
}
var ss = SpreadsheetApp.getActiveSpreadsheet();
var sheet = ss.getSheetByName("Data");
var last = sheet.getLastColumn();
sheet.insertColumnAfter(last);
// first 2 cells are constant
var values = [
[ SpeedVarName ],
[ "0" ],
];
var range = sheet.getRange(1, last + 1, 2, 1);
range.setValues(values);
// formula is "=SPEED3-SPEED2"
var cell = sheet.getRange(3, last + 1);
cell.setFormula("=" + OBDSpeed + "3-" + OBDSpeed + "2");
var rangeToCopy = sheet.getRange(3, last + 1, 1, 1);
rangeToCopy.copyTo(sheet.getRange(3, last + 1, sheet.getLastRow() - 2, 1));
SpeedVar = findColumnByName(SpeedVarName);
printLog("speed variation column added");
}
function insertGlideColumn() {
Glide = findColumnByName(GlideName);
if (Glide != -1) {
return;
}
var ss = SpreadsheetApp.getActiveSpreadsheet();
var sheet = ss.getSheetByName("Data");
var last = sheet.getLastColumn();
sheet.insertColumnAfter(last);
var range = sheet.getRange(1, last + 1, 1, 1);
range.setValue(GlideName);
// formula is "=if(and(RPM2<500;SPEED2>10;abs(BATTPACKCURRENT2)<5);1;0)"
var cell = sheet.getRange(2, last + 1);
cell.setFormula("=if(and(" + RPM + "2<500;" + OBDSpeed + "2>10;abs(" + BattPackCurrent + "2)<5);1;0)");
var rangeToCopy = sheet.getRange(2, last + 1, 1, 1);
rangeToCopy.copyTo(sheet.getRange(2, last + 1, sheet.getLastRow() - 1, 1));
Glide = findColumnByName(GlideName);
printLog("glide column added");
}
function activateSheetByName(name) {
var ss = SpreadsheetApp.getActiveSpreadsheet();
var sheet = ss.getSheetByName(name);
ss.setActiveSheet(sheet);
}
// returns only letter of the column with the given name in the first cell
function findColumnByName(name) {
var ss = SpreadsheetApp.getActiveSpreadsheet();
var sheet = ss.getSheetByName("Data");
var last = sheet.getLastColumn();
var foundcolumn = -1;
for (var i = 1; i <= last; i++) {
var cell = sheet.getRange(1, i);
var value = cell.getValue();
if (value == name) {
foundcolumn = cell.getA1Notation();
printLog("Found column " + name + " at " + foundcolumn);
}
}
if (foundcolumn == -1) {
printLog("Column " + name + " not found");
}
else {
foundcolumn = foundcolumn.substring(0, foundcolumn.length - 1);
}
return foundcolumn;
}
// set "-" to "0" and check if there are values > max
function sanitizeColumn(column, max) {
var ss = SpreadsheetApp.getActiveSpreadsheet();
var sheet = ss.getSheets()[0];
var range = sheet.getRange(column + ":" + column );
var height = range.getHeight();
var values = range.getValues();
var foundnull = false;
printLog("checking " + height + " values at column " + column);
for (var i = 0; i < height; ++i) {
if (values[i] == "-") {
var cell = range.getCell(i + 1, 1);
cell.setValue(0);
foundnull = true;
}
if (values[i] > max) {
printLog("ERROR: Values in column " + column + " out of range, check for import errors");
}
}
if (foundnull)
printLog("some missing values in column " + column);
}
// set global vars to columns position
function findNeededColumns() {
OBDSpeed = findColumnByName(OBDSpeedName);
RPM = findColumnByName(RPMName);
BattPackCurrent = findColumnByName(BattPackCurrentName);
SOC = findColumnByName(SOCName);
}
function sanitizeNeededColumns() {
sanitizeColumn(OBDSpeed, 300);
sanitizeColumn(RPM, 10000);
sanitizeColumn(BattPackCurrent, 300);
sanitizeColumn(SOC, 100);
}
// main
addLogSheet();
printLog("Begin data processing");
setDataName();
activateSheetByName("Data");
findNeededColumns();
sanitizeNeededColumns();
insertSeparatorColumn();
if (OBDSpeed != -1) {
insertSpeedVarColumn();
}
else {
printLog("ERROR: Could not add speed variance column");
}
if ((OBDSpeed != -1) && (RPM != -1) && (BattPackCurrent != -1)) {
insertGlideColumn();
}
else {
printLog("ERROR: Could not add glide column");
}
addAnalysisSheet();
printLog("End data processing");
}
=== CUT HERE ===
Now select "File / Save" and then "Run / AnalyzeTorqueLogs"
You will have to authorize the script
After the script has finished running, switch back to the spreadsheet, and you'll see a new tab named "Analysis".
This first version compute some sample parameters regarding the HV battery:
start and end charge, and average value vs the value considered the best by some hypermilers (60%).
There are some other values that may answer some curiosity about the car inner working:
the percentage of the time the petrol engine was actually off during the trip,
the percentage of time the car was moving using very little energy (glide),
the longest glide time of the trip
a battery "stress" value, that evaluates how may amperes have flown in and out of the battery: a higher value means higher stress, but a meaningful range has yet to be established.
NOTE:
This new version add some parameters:
how many times ICE was turned on during the trip
how many ICE ignitions lasted less than 5 seconds (those are considered just a waste of fuel)
an evaluation of speed variance during the trip: this should give an idea of your driving stile (calm or aggressive).
| Ignitions | 13.00 | Times ICE was turned on |
| Inefficient Ignitions | 1.00 | Times ICE was turned on for less than 5 seconds |
| Average Speed | 41.08 | |
| Top Speed | 77.00 | |
| Average Absolute Variation | 1.97 | Speed variations during the trip (only while moving) |
2013-09-14
Rorschach Test
These are data of car speed at various RPMs.
Same road, different driving stile:
We always have 2 aggregation points:
one at 0 RPM, where we have the car running on electric power up to 70 km/h, and one at 1300 RPM, that seems to be the sweet spot of the engine.
Speedy driving leads to higher RPM and a wider distribution.
Use of EV mode, leads to higher RPM than normal: note the aggregation around 2100 and the gap between 1300 and 1600.
Same road, different driving stile:
We always have 2 aggregation points:
one at 0 RPM, where we have the car running on electric power up to 70 km/h, and one at 1300 RPM, that seems to be the sweet spot of the engine.
Speedy driving leads to higher RPM and a wider distribution.
Use of EV mode, leads to higher RPM than normal: note the aggregation around 2100 and the gap between 1300 and 1600.
2013-09-01
Metallic noise from the hood
While driving in EV mode on bumpy roads, I've heard some metallic noise coming from the hood.
At first, I thought it was the hood itself, but at a closer examination I've excluded it because it rests on rubber supports while closed.
Maybe today I've found the source of the noise.
There's a felt-like rigid sheet under the hood. It's bolted on all sides except one, where it can vibrate against the hood.
I've placed a small wooden spacer to keep it in place.
I'll see in the next days if the noise will vanish.
At first, I thought it was the hood itself, but at a closer examination I've excluded it because it rests on rubber supports while closed.
Maybe today I've found the source of the noise.
There's a felt-like rigid sheet under the hood. It's bolted on all sides except one, where it can vibrate against the hood.
I've placed a small wooden spacer to keep it in place.
I'll see in the next days if the noise will vanish.
2013-08-26
A little tour on the hills
Time for a little tourism near home: Langhe
View Larger Map
The trip was about 150 km with a consumption of 3.9 l/100km, with AC on.
By comparison, a similar trip with my Ford C-Max 1.6TD scored 4.8 l/100km.
Comfort is second to none: the CVT allows for a relaxed driving and the overall silence allows enjoying the view.
View Larger Map
The trip was about 150 km with a consumption of 3.9 l/100km, with AC on.
By comparison, a similar trip with my Ford C-Max 1.6TD scored 4.8 l/100km.
Comfort is second to none: the CVT allows for a relaxed driving and the overall silence allows enjoying the view.
2013-08-12
Practice makes perfect
Lately, I've been able to practice this slope.
Time after time, I learned to maximize recharge and I've come to this:
At the end of the slope, battery is 8 bars full, with a gain of 16% versus 14% of my first attempts:
There's a noticable difference in the charging current: in this run we have a steady flow to the end of the slope.
This is even more evident in the following graphs, where wheel cylinder pressure is sensibly lower than the previous run.
The pratical effect of having a fully charged battery can be felt in the next 3 km, where the car runs in EV mode up to nearly 70 km/h.
Time after time, I learned to maximize recharge and I've come to this:
At the end of the slope, battery is 8 bars full, with a gain of 16% versus 14% of my first attempts:
There's a noticable difference in the charging current: in this run we have a steady flow to the end of the slope.
On the previous attempt, charging was interrupted by the intervention of the braking system that was triggered by a hole on the road: whenever the system senses the wheels losing grip during regenerative braking, "classic" braking kicks in, disabling regeneration.
This is even more evident in the following graphs, where wheel cylinder pressure is sensibly lower than the previous run.
Previously, pressure ramped up and current levelled down.
The pratical effect of having a fully charged battery can be felt in the next 3 km, where the car runs in EV mode up to nearly 70 km/h.
2013-08-04
Yaris rear wheel woes
Looking at the rear wheels I noticed that there was something relieved:
A closer look revealed that it was kept relieved by all the sand and small stones that probably got inside from the road.
To remove all the dirt, you'll need to detach the whole piece by unscrewing the screw that's directly below.
Be prepared to repeat from time to time, as the front is not tightly coupled with the rest, so all the dirt from the road will collect inside.
Who's the engineer that came up with such a bad design in a car with one of the most advanced engine?
A closer look revealed that it was kept relieved by all the sand and small stones that probably got inside from the road.
To remove all the dirt, you'll need to detach the whole piece by unscrewing the screw that's directly below.
Be prepared to repeat from time to time, as the front is not tightly coupled with the rest, so all the dirt from the road will collect inside.
Who's the engineer that came up with such a bad design in a car with one of the most advanced engine?
2013-08-01
Winter vs Summer
Last winter, when the car was brand new, I've got my best mileage on an one hour 50km trip hillside, with 3.9 l/100km. Even if it was winter, I didn't use any heating.
Today I had the chance to drive the same trip again.
This time I've scored 3.7 l/100km, with A/C on.
2013-07-28
GPS temporal displacement
Everybody uses GPS.
We already know that the positioning provided has an error, usually in the range of 4 to 10 meters.
That's about space, but what about time?
By using Torque we can estimate it.
Torque log files contains GPS coordinates and the speed calculated from GPS readings: we can try to relate it to the speed reading from OBD, that is instantaneous, while the GPS speed is subjected to the delay induced by the GPS itself.
2013-07-21
Checking the 12V battery of the Yaris Hybrid without opening the back seat
The 12V battery of the Yaris Hybrid is located in a not-so-easy to access place, so a easier way to check battery health may come handy.
Newer versions of the Yaris Hybrid seem to have a jump start socket in the fuse box under the hood, on the driver's side.
I was wondering if the old ones may use the same trick.
My fuse box has a bolt where newer ones have the socket
so I just checked with a voltmeter and I saw that it carries the same voltage of the back seat battery.
Readings are the same as measured directly at the battery clamps.
So battery voltage can be measured from the engine hood instead of opening the back seat.
2013-07-05
Speed and Charge
How much current can you get from speed?
In the following graph:
- speed is in blue, left vertical axis
- RPMs in red, right axis, useful to check when the engine stops beeing dragged.
- change current in yellow, left axis, negative values are indicative of recharge.
I drove a straigh, plain road up to 76 km/h and then I left the accelerator pedal alone, to let the car loose speed until 46 km/h (see the blue line decreasing over time)
The engine continued to spin without burning any fuel, then at 66 km/h it stopped (see the sudden break in the red line).
Charging current is not steady, it follows the speed, but not linearly (check the yellow line, lower values mean higher charge).
A graph of current values by speed shows a pattern:
Higher current values are in the lower part of the graph.
The higher recharge effect is at 66 km/h with 24A.
That is precisely the speed where the engine stopped, but neighbouring values vary widely.
The slope returns to a linear behavior at 62 km/h with 22A.
So, if you're going to drive down a hill and you want to maximize your recharge, it's better to drive at 60 km/h rather than 70.
2013-06-22
2013-06-16
Different routes, different mileage
Sometimes I read posts of people disappointed by the mileage results of their Yaris Hybrid.
Results are heavily influenced by the kind of your average trip.
By comparison, in this season, my daily commute home-work-home, a 9+9km trip on urban and plain suburban roads, scores 4.2 l/100km.
A different trip, home-countryside-home, a slightly longer 12+12km trip on urban and hill roads, scores 3.8 l/100km (with A/C on).
Results are heavily influenced by the kind of your average trip.
By comparison, in this season, my daily commute home-work-home, a 9+9km trip on urban and plain suburban roads, scores 4.2 l/100km.
A different trip, home-countryside-home, a slightly longer 12+12km trip on urban and hill roads, scores 3.8 l/100km (with A/C on).
2013-06-15
Using Google Docs to chart Torque data
Once you've logged your data with Torque, you should end up with a zip file.
.

you'll find the actual data inside a CSV file.
extract it.
drag it into google drive, selecting "Convert document"
google drive will convert it to a spreadsheet document.
warning: columns order and name may vary according to your PID logging configuration.
first you need to normalize the B column that contains timestamps: we'll need that for later charts.
perform a "find and replace", replacing the first part of the date with a null string.
you'll notice that the B column will be automatically formatted with HH:MM:SS.
now we can draw a chart of RPMs and Speed.
choose Insert -> Chart:
click the small grid inside "Data - Select ranges" and select the following columns in this precise order:
Time
GPS Speed
Engine RPM
the Time column must be the first, so it will be automatically selected for the horizontal axis.
select the area chart type.
with some label customization, the chart is ready for prime time.
now we can try to extract some more data.
add 5 new columns to the right.
insert into M2 the following formula and paste it all the way down:
=if(and(J2=0, C2 <>0);100;0)
meaning that if RPMs (the J column) are zero (engine is idle) and speed (column C) is non-zero (we're moving), we'll have a sintetic value of 100; zero otherwise.
this will highlight when the car is moving with the engine off.
insert into N2 the following formula and paste it all the way down:
=if(C2 <>0;200;0)
if speed is non-zero, we'll have 200 to highlight travelling.
we'll use cell O2 to count the samples when engine was off with the car still moving.
we sum all the M column and divide by the sintetic factor 100, used in the M column formula.
=sum(M2:M991)/100
cell P2 will count travel time by adding column N and dividing by 200.
=sum(N2:N991)/200
now, we can calculate the percentage of time in which the engine was off during the entire trip.
=O2*100/P2
we can have a visual representation of our emission-free traveling by creating a chart of columns B, N and M, as before.
2013-06-11
Braking, HSD style.
Here is a long brake on a straight road, right before a traffic light.
Speed in blue
Hydraulic brake in black
Charging current in red
At 5:02:22, at a speed of 57 km/h, I began applying pressure on the brake pedal.
I applied the same pressure throughout the whole maneuver.
As soon as began braking, some current started flowing to the battery as the charging effect of the speed loss.
Current topped at 75A at 41 km/h.
At 5:02:37, as soon as speed lowered to 10 km/h, hydraulic braking kicked in.
Speed in blue
Hydraulic brake in black
Charging current in red
At 5:02:22, at a speed of 57 km/h, I began applying pressure on the brake pedal.
I applied the same pressure throughout the whole maneuver.
As soon as began braking, some current started flowing to the battery as the charging effect of the speed loss.
Current topped at 75A at 41 km/h.
At 5:02:37, as soon as speed lowered to 10 km/h, hydraulic braking kicked in.
2013-06-10
Downhill reloaded
I tested again the same slope.
This time driving in D.
It seems there's still an exponential charging at the beginning (15:13:00 - 15:13:45), and then a linear progression.
Here's the speed graph:
One hypothesis for the change from exponential to linear of the charging progression was battery temperature.
Here's the current flow, charging the battery.
At 15:14:25 there's a sudden break.
At that time, the system began to use hydraulic brakes.
Note that at 15:14:45 brakes were not in use, but Amperes stayed low, even if speed was well in excess of 45km/h.
This time driving in D.
It seems there's still an exponential charging at the beginning (15:13:00 - 15:13:45), and then a linear progression.
Here's the speed graph:
One hypothesis for the change from exponential to linear of the charging progression was battery temperature.
Here's the current flow, charging the battery.
At 15:14:25 there's a sudden break.
At that time, the system began to use hydraulic brakes.
Note that at 15:14:45 brakes were not in use, but Amperes stayed low, even if speed was well in excess of 45km/h.
Subscribe to:
Posts (Atom)


.png)


.png)

.png)