2013-06-29

A stroke of genius

I'm going to nominate for the Nobel prize whoever has invented this:


The asymmetric USB connector.
At last you can plug it right at the first try without even looking.

2013-06-16

Different routes, different mileage

Sometimes I read posts of people disappointed by the mileage results of their Yaris Hybrid.
Results are heavily influenced by the kind of your average trip.
By comparison, in this season, my daily commute home-work-home, a 9+9km trip on urban and plain suburban roads, scores 4.2 l/100km.
A different trip, home-countryside-home, a slightly longer 12+12km trip on urban and hill roads, scores 3.8 l/100km (with A/C on).


2013-06-15

Using Google Docs to chart Torque data

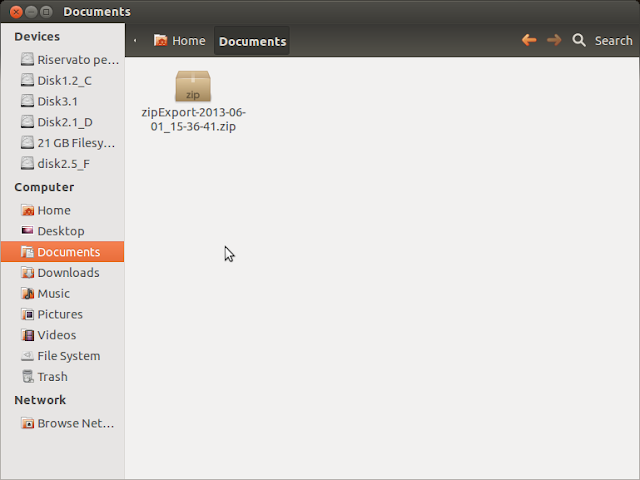
Once you've logged your data with Torque, you should end up with a zip file.
.

you'll find the actual data inside a CSV file.


extract it.


drag it into google drive, selecting "Convert document"


google drive will convert it to a spreadsheet document.
warning: columns order and name may vary according to your PID logging configuration.


first you need to normalize the B column that contains timestamps: we'll need that for later charts.
perform a "find and replace", replacing the first part of the date with a null string.


you'll notice that the B column will be automatically formatted with HH:MM:SS.


now we can draw a chart of RPMs and Speed.
choose Insert -> Chart:


click the small grid inside "Data - Select ranges" and select the following columns in this precise order:
Time
GPS Speed
Engine RPM
the Time column must be the first, so it will be automatically selected for the horizontal axis.


select the area chart type.


with some label customization, the chart is ready for prime time.

now we can try to extract some more data.
add 5 new columns to the right.


insert into M2 the following formula and paste it all the way down:


=if(and(J2=0, C2 <>0);100;0)

meaning that if RPMs (the J column) are zero (engine is idle) and speed (column C) is non-zero (we're moving), we'll have a sintetic value of 100; zero otherwise.
this will highlight when the car is moving with the engine off.

insert into N2 the following formula and paste it all the way down:

=if(C2 <>0;200;0)

if speed is non-zero, we'll have 200 to highlight travelling.


we'll use cell O2 to count the samples when engine was off with the car still moving.
we sum all the M column and divide by the sintetic factor 100, used in the M column formula.


=sum(M2:M991)/100

cell P2 will count travel time by adding column N and dividing by 200.

=sum(N2:N991)/200

now, we can calculate the percentage of time in which the engine was off during the entire trip.

=O2*100/P2

we can have a visual representation of our emission-free traveling by creating a chart of columns B, N and M, as before.


2013-06-13

Torque Logging Tutorial

Select "Settings" from the main screen menu.

 Select "Data Logging & Upload"

 Touch "Select what to log"

 Using "Add PID to log" select which values you want to collect

 Back to the previous screen, scroll down to select "Also log selected sensors"

 Connect to the car, go to the "Realtime Information" screen and select "Start Logging"

 When you trip is over, select "Stop Logging" and go to the Map View screen.
Use "Select recorded trip" to load your previous log file.

Then select "Send trip file.."
Select CSV, and copy the file.


2013-06-11

Braking, HSD style.

Here is a long brake on a straight road, right before a traffic light.
Speed in blue
Hydraulic brake in black
Charging current in red

At 5:02:22, at a speed of 57 km/h, I began applying pressure on the brake pedal.
I applied the same pressure throughout the whole maneuver.
As soon as began braking, some current started flowing to the battery as the charging effect of the speed loss.
Current topped at 75A at 41 km/h.
At 5:02:37, as soon as speed lowered to 10 km/h, hydraulic braking kicked in.

2013-06-10

Downhill reloaded

I tested again the same slope.
This time driving in D.
It seems there's still an exponential charging at the beginning (15:13:00 - 15:13:45), and then a linear progression.
Here's the speed graph:
One hypothesis for the change from exponential to linear of the charging progression was battery temperature.
Here's the current flow, charging the battery.
At 15:14:25 there's a sudden break.


At that time, the system began to use hydraulic brakes.
Note that at 15:14:45 brakes were not in use, but Amperes stayed low, even if speed was well in excess of 45km/h.


2013-06-09

Comparison of GPS performance across different Android devices

I had the chance to test GPS on a Galaxy Mini 2 and a Galaxy S2 Plus.
The test was done in the same place, one phone after the other.
Both phones didn't have any data connection, cellular of Wi-Fi, so positioning was done using only plain GPS.
Here is the Galaxy Mini 2.
Locking took 60 seconds with 5 satellites.


The Galaxy S2 Plus got its lock in 3 seconds with 16 satellites.


Note that on both phones, compass was way off.

2013-06-03

Start-Stop vs HSD


"My car also turns itself off at a traffic light!"
This is a classic when someone is on the passenger seat, while driving.

Modern, non-hybrid cars have a start-stop system that shuts the engine down while standing still.

This is fundamentally different from an hybrid car:
A conventional car shuts the engine off after the car has stopped, and re-ignite it before moving again.
The HSD system works the opposite way: the engine shuts down before stopping and it starts again after the car is already moving.

Here is the detail of a stop at a traffic light.
Engine rpms in red; speed in blue.
The car comes to a full stop a 15:09:35 and starts again at 15:09:40:
The engine stops 30 seconds before the real stop, and starts again after the car is already in motion.

Driving downhill in B

I tried the same slope using the B gear instead of D.


Here is the original graph, while driving in D:
Now the same road again, in B:


The battery started at a different level then before but, driving in B, gained a 13% charge, a minimal difference against the 14% gained while driving in D.

Here are the speed graphs.
D:
B:

Driving in B will force you to press the gas pedal to gain some speed where the slope is not steep enough.
Look at 19:06:30, where the slope begins: the car builds up speed slower than when driving in D.

Some more graphs:


Are there 2 different revisions of Yaris Hybrid?

When I received my Yaris Hybrid, one the first things I checked was the 12V battery jump start procedure.
The manual clearly states that you need to access the battery located under the back seat and attach the jumper cables there.

It seems that new cars delivered in 2013 undergone a review of the fuse box.
They have a positive battery terminal where a jumper clamp can be attached, so you don't have to access the back seats.

The old ones seem to miss that terminal.
The car manual has been changed as well.

Here is my right fuse box, with no terminal available:


and the left one: